Know Your Learning Target and Goal Setting

The March Educational Leadership has an article by Moss, Brookhart, and Long titled “Know Your Learning Target” that argues that students who know their learning goal are “empowered, self-regulating, motivated, and intentional learners.”  With a high quality learning target a student should be able to answer the following questions:

  1. What will I be able to do when I’ve finished the lesson?
  2. What idea, topic, or subject is important for me to learn and understand so that I can do this?
  3. How will I show that I can do this, and how well will I have to do it?

The reality is that “knowing your learning target” can do more than “create empowered, self-regulating, motivated, and intentional learners” when merged with specific goal-setting behaviors that are known to have an impact on student achievement.  Hattie (2009) found that a number of meta-analysis showed a strong positive impact from goal setting (d=0.56). Hattie (2009) cited Locke and Latham’s (1990) seminal book “A Theory of Goal Setting and Task Performance” is arguing that a goal must include:

  1. Clarity (see also Martin 2006)
  2. Challenge (see also Martin 2006)
  3. Commitment (see also Klein, Wesson, Hollenbeck, and Alge 1999)
  4. Feedback

In other words, if the learning targets that students are seeking to achieve are clear, challenging, and include a commitment and cycles of feedback the student is likely to learn even more. 

Klein, Wesson, Hollenbeck, and Alge (1999) Goal commitment and goal-setting process: Conceptual clarification and empirical synthesis. Journal of Applied Psychology, 84(6), 885-896.

Martin, A.J. (2006) Personal Bests (PBs): A proposed multidimensional model and empirical analysis.  British Journal of Educational Psychology, 76, 803-825.

Posted in Uncategorized | 1 Comment

MET Project: A Suggestion for Further Research

Measures of Effective Teaching (MET) Project is an effort sponsored by the Bill and Melinda Gates foundation aimed at determining ways to measure effective teaching fairly and consistently. The project is collecting oodles of video-taped classroom observations, student surveys, and other data and correlating with student performance data to see if they can identify those behaviors that matter most. MET argues that with multiple measures of effectiveness a better teacher evaluation can be developed. With a better teacher evaluation more meaningful tenure, differentiated pay, strategic placement of teachers, and targeted professional development can result in more effective teachers and higher performing students. MET plans to release a report this year with a composite measure of effectiveness.
I believe MET should continue their research following the release of this report on effective teaching. MET should conduct research on the impact of reflection and feedback using the same infrastructure they already have in place. Currently teachers upload a video of their lesson (they upload four throughout the year) and they send a reflection on that lesson. I encourage MET to design an experiment where one group of teachers received feedback on their lesson from an expert and one group did not. The group selected to receive feedback would be split into two groups: (1) one group that would receive written feedback and also participate video coaching sessions (using video chat) and (2) one group that would receive written feedback alone. Previous research has shown that video/audio feedback works and MET could use the student achievement results to compare the three groups and determine if there is a measurable impact from written feedback and online coaching. Further down the road MET could also analyze the coaching feedback videos and determine what kinds of feedback are effective as well.

Posted in Professional Development, Research, Teacher Effectiveness | Tagged , , , | Leave a comment

Measure What Matters

Great teaching is one of the inputs that will lead to student learning. In fact, it is one of the only inputs educators have control over. Because of this we invest time and money into providing high quality professional development and create opportunities for feedback so that teachers will improve and student academic achievement will likewise improve.

Unfortunately, we spend little time determining whether our professional development has been effective. We should not wait to see if student achievement increases to determine if our professional development efforts have been effective. We should be continuously monitoring what we expect to occur. A consequence of professional development should be a change in teacher behavior. Our only effective method for determining whether teachers are changing behavior is to observe them in action. In short, administrators should in the classroom observing whether their professional development efforts are impacting teacher behaviors.

I know people in education think that student achievement is an appropriate measure to determine the effectiveness of professional development, but it isn’t. If the point of professional development is to change the input (teaching practice), then that is what needs to be measured.

Posted in Measurement | Tagged , | Leave a comment

Leadership with Data

In a recent post on leadership I noted that research has identified five principal practices as having a significant effect on student achievement.  Among the behaviors “promoting and participating in teacher learning and development” has the greatest effect size.  So, what does that mean for a school working on becoming a “data-driven school”? 

First, the principal is involved.  They attend the professional development and the engage in the collaborative inquiry. 

Second, they should frame the problems for inquiry, help search for evidence, invite alternative viewpoints, help make collective sense, ensure action, and generate feedback

Finally, the principal should bring some expertise to the discussion and be willing to engage in the day to day work of looking at student data.  This last action will take time, but have a lasting impact on the skills and abilities of the staff.

In grad school I would work feverishly to collect data, scrub the data, run statistical tests (e.g. t-tests, ANOVAs, etc.), and generate as many possible scatter plots as my Pentium I computer could handle. I would print my “results” and stare with black pen in hand to mark the compelling patterns. Without fail my advisor would come and join me for these analytic sessions. The story was the same every time: he would cast aside the statistical tests saying “there is nothing to see in those numbers” and then meticulously he would draw circles around relationships on the scatter plots that he thought looked interesting. Sometimes these circles looked like amoebas and sometimes they looked like obvious patterns I had missed.  This was not the way I had learned to approach data in statistics class.  However, the man I was working with had a lifetime of experience that trumped a statistics textbook (he also had more honorary Ph.D.s than I could count and had been inducted to the National Academy of Science on three continents).  We would end these sessions with him saying, “I want to know more about what is going on with these cases and why variance exists.” 

My advisor’s expertise and inquisitiveness always opened doors to new knowledge.  Beyond that his tactic of learning with me bred skill and confidence.  My advisor never taught me to analyze data. He engaged me and encouraged me to be curious. I learned by watching and practicing.  

A culture of high-quality data analysis depends on leadership. It depends on high expectations for all members of the culture (teachers and administrators). Administrators must accept the mantle to be data analysis leaders. To be more prepared than their staff. Administrators need not come with the answers, but with the questions, ideas, and the willingness to engage with the information. Administrators need to nurture teachers and challenge them to be curious.

Posted in Data Analysis, Leadership | Tagged , | Leave a comment

Data Analysis Principle #1: Enforce Comparison

Ten years ago I attended a seminar by Edward Tufte that described how to effectively display quantitative data. I recently ran across the notes from this seminar and was reminded of a few key points that are relevant to data in the K-12 setting. One of Tufte’s Grand Principles was that any data display must “enforce visual comparison”. In other words, we must always ask the question, “compared to what?”.

To “enforce comparison” be sure to: (1) select a relevant comparative dataset, (2) place the comparative data on the same graphic (or minimally on the same page), and (3) acknowledge the comparative data in the descriptive phase of any data dialogue.

The relevance of the comparative dataset can be measured on two-dimensional grid (crappy image hand drawn) with relevance on the x-axis and the difficulty of acquiring the comparison on the y-axis. The ideal scenario is to obtain extremely relevant comparison without considerable effort. Highly relevant comparative data would be from schools or classrooms that are demographically similar. However, the most common occurrence is that we obtain comparative data that marginally relevant, but easy to obtain. For example, when we compare the performance of students within a school to all the other students nationally without taking into account demographic or longitudinal growth factors. Since highly relevant comparative data are often difficult to obtain and can require some statistical or technical sophistication to distill, teachers are often reduced to using the less relevant data. Teachers and administrators should ask for more relevant comparative data from central administration and test vendors. In addition, schools should work to create examples of highly relevant comparative datasets by comparing students and classrooms within the school.

Visual design is often overlooked in presenting student, school, or district achievement data. Data displays are often sloppy and fail to place comparative data that are necessary for analysis in proximity with the school data. It is important to place the comparative on the same graphic or minimally on the same page.

High quality fact-based statements about student data of any kind reference comparative datasets. Avoid simply saying, “3rd grade students scored 65% proficient or above on the summative assessment.” Even saying, “3rd grade students scored 65% proficient or above on the summative assessment, which is a 4% improvement over the previous year” is unsatisfactory because the previous year data are not necessarily a relevant comparative dataset (different students in a different year). On the other hand, saying “3rd grade students at Betcher Elementary school score 25 scale score points higher on vocabulary than demographically similar students from across the district” makes a statement of performance relative to a relevant comparative dataset.

While Tufte is focused on effective use of visual display to convey a message (make a causal statement), his principle of Enforce Comparison is extremely relevant as a basic starting point for educators engaged in data-driven decision making.

Posted in Data Analysis | Tagged | Leave a comment

Extended Time

By now you have heard that Barack Obama wants to extend the school year by increasing the 21st Cenutry Learning Community grants. This is not the first time Obama has argued the point that the school year is too short for the United States to be competitive. President Obama wants to extend the school year to 195 or greater days. Last Fall I received an edition of Review of Educational Research, which included an article by Erika Patall and colleagues assessing the research on extended school day or school year. The summarizing statement on the impact on achievement says: (1) in a worst case scenario extending the day or year has no impact on achievement. In the best case scenario there may be a small relationship on achievement, but the magnitude remains difficult to measure. (2) Extending school time for students at risk for failure is likely beneficial. This finding is consistent with the research on summer learning loss for at risk students.

Patall concludes that “extending school time can be an effective way to support student learning, particularly (a) for students most at risk of school failure and (b) when considerations are made for how time is used.” Thus, school districts planning to extend the day or year cannot depend on time alone to make a difference, but to maximize the return of the taxpayers they must make this change in a framework (a system) that includes improving instructional strategies on the whole. If a focus is placed on ensuring that both time and quality are enhanced, then this will be a worthwhile decision.

From the performance management/strategy perspective this means that school districts must make this decision to extended their day/year when they have sufficiently improved instructional quality. Districts must be actively measuring instructional quality (using measures such as spot observations and evaluations rather than just test scores) to ensure that when extended day/year is implemented they can show their taxpayers that it will result in meaningful results.

Photo Credit

Posted in Extended Time | 2 Comments

Predicting Student Performance Using NWEA (A tool for Illinois)

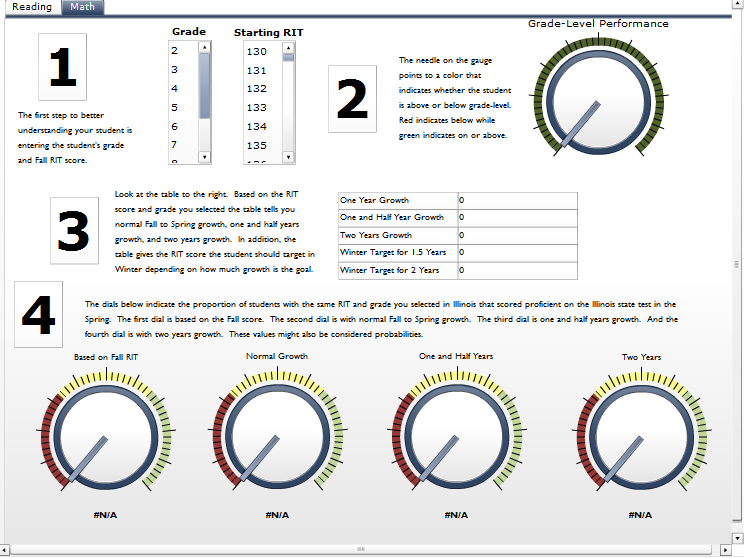
In the Fall I saw this presentation online about how Teach for America teachers in Illinois create student targets for growth.  Scenario 1 caught my eye because it was using NWEA MAP data.  My opinion was most tools available now for doing what was outlined in this presentation were not very usable, so I designed a flash interface using Excelsius that immediately told a teacher what the student’s likely one, one and half, and two year growth targets are based on their starting point.  What’s more, the tool immediately tells the user what the student’s probability of scoring proficient on the state test is based on those various growth scenarios. (Click the tool to go to the actual flash interface)

Posted in NWEA, Tools | Leave a comment

Behaviors of an Instructional Principal

Instructional leadership trumps transformational leadership.  In the article “The Impact of Leadership on Student Outcomes: An Analysis of the Differential Effects of Leadership Types” by Viviane Robinson, Claire Lloyd, and Kenneth Rowe they found five specific behaviors that impacted student achievement:

  1. Establishing goals and expectations.
  2. Resourcing strategically.
  3. Planning, coordinating, and evaluating teaching and the curriculum.
  4. Promoting and participating in teacher learning and development.
  5. Ensuring an orderly and supportive environment.

Each of these behaviors had measurable effect on student achievement.  Below is a description of what each of these practices.

Establishing goals and expectations is described as setting, communicating, and monitoring learning goals, expectations, and the involvement of staff and others in the process so that there is clarity and consensus on goals.  Robinson et. al. (2008) found in meta-analysis that the degree of emphasis on clear academic and learning goals had a measurable impact on student achievement.  These goals need to be embedded into school and classroom routines to be most effective.  These principals need to emphasize communicating goals and expectations, informing the community, and celebrating when achievement does occur. 

Resourcing strategically refers to acquiring resources that are aligned with the academic goals of the school.  This is not to be confused with the act of bringing money into the school or fundraising.  A better interpretation would be how well a principal aligns their resources with their goals.  A principal that is data-driven would dedicate some resources to the stated goal of using data to improve instructional outcomes. 

Planning, coordinating, and evaluating teaching and the curriculum refers to the personal involvement of the leader in collegial discussions, active oversight of instruction, regular classroom visits and feedback events for the teachers, and ensuring that teachers are progress monitoring students.  These leaders are actively looking at how instruction is impacting student achievement. 

Promoting and participating in teacher learning and development is described as more than just supporting or sponsoring professional development.  The leader must participate, formally and informally, as both a leader and learner.  Of the five practices that Robinson et. al. (2008) found impacting student achievement this one had the high effect size.  The more active teachers reported that principals were in teacher learning and development, the higher the achievement scores (with background factors controlled for).  Teachers in higher performing schools were also more likely to identify their principal as a likely source of instructional advice. 

Ensuring an orderly and supportive environment is described consistently enforced discipline codes and social expectations.  The more teachers, parents, and students felt safe, comfortable, and cared for the higher students performed (when background factors were controlled).  The principal has to be able to also protect teachers from unreasonable pressure from outside forces, including parents and district officials.


Posted in Leadership | Leave a comment

Instructional versus Transformational Leaders

Recent research has found that leadership can have a considerable impact on student achievement.  The research is specific about which behaviors matter most for student success.  Leaders that stay focused on student achievement and instructional strategies (instructional leaders) have far greater impact on achievement than leaders that try to motivate followers to a cause (transformational leaders).  One recent study of particular interest is a meta-analysis (analysis of multiple previous research studies) by Viviane Robinson, Claire Lloyd, and Kenneth Rowe titled “The Impact of Leadership on Student Outcomes: An Analysis of the Differential Effects of Leadership Types”.  Robinson et. al. do more than just show there is a difference between instructional leaders and transformational leaders, they go on to identify the specific “dimensions” or behaviors of the most effective leaders.  Out of five “dimensions” (1. establishing goals and expectations, 2. resourcing strategically, 3. planning, coordinating, and evaluating teaching and the curriculum, 4. promoting and participating in teacher learning and development and 5. ensuring an orderly and supportive environment)  participating in teacher learning as both leader and learner had the greatest impact.  This should mean that the days where the principal acts as sponsor or support of professional development are gone.  If the professional development is focused on a primary instructional strategy then the principal should be present. 

Posted in Leadership | Leave a comment