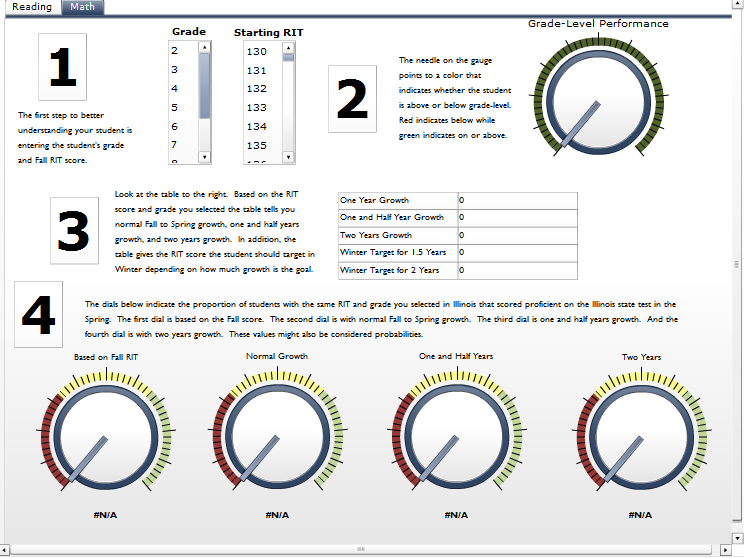
In the Fall I saw this presentation online about how Teach for America teachers in Illinois create student targets for growth. Scenario 1 caught my eye because it was using NWEA MAP data. My opinion was most tools available now for doing what was outlined in this presentation were not very usable, so I designed a flash interface using Excelsius that immediately told a teacher what the student’s likely one, one and half, and two year growth targets are based on their starting point. What’s more, the tool immediately tells the user what the student’s probability of scoring proficient on the state test is based on those various growth scenarios. (Click the tool to go to the actual flash interface)

-
Recent Posts
Recent Comments
- on Extended Time
- on Visualizing A Process
- Samara Williams on Extended Time
- Samara Williams on Visualizing A Process
- Goal Setting for Students | josephjamesmiller.com on Know Your Learning Target and Goal Setting
Archives
Categories
Meta
