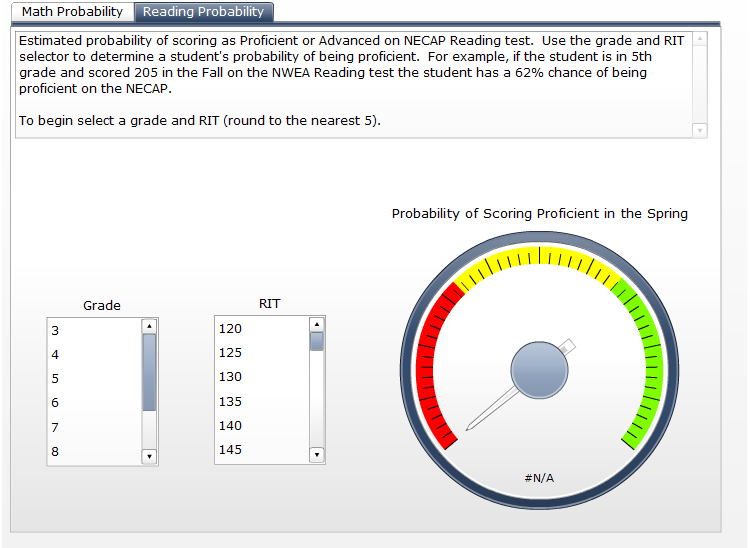
NECAP Proficiency Predictor Using NWEA MAP

The tool below shows the probability that a student is going to score proficient (or better) on the NECAP based on fall NWEA MAP scores.  Select the student’s grade and approximate score on MAP reading or math.  The tool returns a probability between 0 and 1.

Posted in Data Analysis, New Hampshire, Tools | Tagged , | Leave a comment

Activating and Engaging (is it really necessary?)

Bruce Wellman and Laura Lipton (2004) have developed a widely used method for looking at student data called the “Data-Driven Dialogue” (DDD).  The dialogue includes three steps: (1) activating and engaging, (2) exploring and discovering, and (3) organizing and integrating.  There have been numerous studies that have found that schools and districts that use are more successful than those that do not.  However, there is not a body of research that supports one method over another for actually analyzing data.  I believe that the first step of the DDD is a waste of time and distracts from effective data analysis, which should focus on identifying patterns. 

In the first step of the cycle (activating and engaging) the participants “surface experiences and expectations”.  Wellman and Lipton include guiding questions in their text such as “with what assumptions are we entering?” and “what are some predictions we are making?”.  Wellman and Lipton state that “by surfacing predictions and assumptions, groups and group members name the frames of reference that are the lenses through which they view the world.”  They argue that by naming these assumptions and predictions participants are able to reframe their decision making. Wellman and Lipton caution against skipping this first step because members will be “lost in a sea of data and opinions.”  They argue that when people don’t know what to expect from one another they enter into defensive postures, ready to attack, or deny the patterns that are revealed.

Despite the assertions of Wellman and Lipton, analyzing data for patterns without first “surfacing assumptions and biases” does not result in being “lost in a sea of data.”   Good analysis should simply start with a description of what is apparent in the data.  An identification of patterns without effort to explain.  My experience in this arena is significant.  I have worked in research, the private sector, public health, and public schools and in all cases I was working with data and facilitating discussions using data.  I have approached the problem by both using the Wellman and Lipton model and without.  By far teachers and administrators are much more successful at efficiently identifying patterns in the data if the “activating and engaging” step is ignored.    

Next time you have an opportunity to facilitate a data discussion or DDD skip the “activating and engaging step.”  Instead, go straight to describing patterns.  See if your participants are any more “lost in a sea of data”.

Posted in Uncategorized | Leave a comment

Late Hires More Likely to Turnover

Interesting article in EdWeek on late hires (those hired after Labor Day).  The study concluded that late hires are twice as likely to leave their schools—or the profession altogether—within a year.  This quickly brought me back to a book I read a little over a year ago: Who: the A Method for hiring. The advocates for a clear hiring method that includes a scorecard, sourcing plan, selection method, and selling strategy. 

Scorecard. The scorecard is a document that describes exactly what you want a teacher to accomplish in their role. It is not a job description with required credentials, but rather a set of outcomes (possibly even test scores) and competencies that define a job done well. By defining A performance for a role, the scorecard gives you a clear picture of what the teacher you seek needs to be able to accomplish.  It helps the applicants and the hiring manager come to immediate understanding of what is desired. 

Source. Finding great teachers is hard for urban school districts, but it is not impossible. Systematic sourcing before you have slots to fill ensures you have high-quality candidates waiting when you need them.  In my last district I strongly advocated for ditching the hiring fairs as a method and instead calling on the placement deans at good education schools much earlier (maybe the fall).  Create buzz at the school early with a dog and pony show.  Get names of the best and the brightest directly from the dean.  Invite them to apply.   Make the application process thorough and competitive. 

Select. Selecting talent in the A Method involves a series of structured interviews that allow you to gather the relevant facts about a person so you can rate your scorecard and make an informed hiring decision. These structured interviews break the voodoo hiring spell.  Might also try to use a screening method.  I am currently working on a screening tool that will allow our district to increase the probability of hiring an effective teacher by comparing survey responses with outcomes in the classroom.

Sell. Once you identify people you want on your team through selection, you need to persuade them to join. Selling the right way ensures you avoid the biggest pitfalls that cause the very people you want the most to take their talents elsewhere. It also protects you from the biggest heartbreak of all—losing the perfect candidate at the eleventh hour.  Do something innovative in the sales process.  In my former district we could not compete on salary.  You had to want to be a part of the team.  The sales pitch had to be around being part of an interesting changing environment.

In my experience school districts do not have anything close to a scorecard for their teachers, source in the worst possible way (hiring fairs) and rarely have a good handle on their openings in the future, and select using a variety of unproven methods that rarely require a demonstration of teaching ability (classroom observation).  Instead, districts focus on what sets them apart  in terms of compensation or location.  Districts think far more about the sales job than what they need for their students.  If districts and schools used a more systemic and thorough approach to hiring based on the A Method they would already have deep in roads to pools of talent at universities (not waiting for hiring fairs), they would have well defined needs which would help them match and retain teachers (because everyone knows what they were getting into), and they would be able to more readily implement a rigorous hiring process.  Yes, late hiring might still be a problem in some cases, but districts and schools that are experiencing it now have to work to reduce that problem by being more systemic.

Posted in hiring | Tagged , | Leave a comment

Jimmer Fredette Sets a Goal and Research Finds Coaching with Goal Setting Works

I saw two interesting stories last week about the importance of setting goals. The first was during the NCAA tournament when CBS reported about Jimmer Fredette’s contract he made with his brother to reach his ultimate dream of playing in the NBA (see the contract here). This was a great human interest story about a kid who made a commitment to sacrifice to achieve a goal. In terms of clarity of what it is going to take it leaves something to be desired, but as a motivator and reminder that it takes hard work to be great it is a fabulous story. Fredette has this contract hanging over his bed.

The second story is about the effectiveness of an organization that works with college students to set goals and manage time. The group, InsideTrack, has been working with college students for years (they report over 250,000 students so far) to clarify their goals, develop their skills, and handle their outside-of-school lives. The coaches communicated with the students via email, text, or telephone nudging them toward completing tasks and steps towards their goals. The results of the study published in Science Magazine found that minority students were more likely to feel like they belonged to the university community and increased their GPA and increased their likelihood of graduating. In short, this study found that goal setting while working with a coach can have a significant impact on school outcomes. As one EdWeek writer noted, one has to wonder if this wouldn’t be effective in high school too.

Posted in Goal Setting, Uncategorized | Tagged , | Leave a comment

NH AYP Excel Tool

Recently I put some data together to look at Adequate Yearly Progress (AYP) Index over time in New Hampshire (download the spreadsheet below to use the tool).  NH calculates an index score based on individual student performance.  The goal is to achieve an index score of 100 overall in each federally mandated sub-category (ethnic/racial groups, low-SES, and special education).  By all the AYP index files together in a single Excel workbook I was able to create a set of pivot charts that can be used to look at the gap between special education and overall AYP index over time.  This workbook can be used to answer the question “is the achievement gap being closed?”. 

Currently the workbook is set-up to compare special education to whole school index scores.  However, by simply changing the variable in the “values” field you can easily look at changes in other areas too.  For example, you could compare the performance of whole school to low-SES.  This comparison can be done by district, for multiple districts (by selecting more than one district in legend field), or by school.  It is a quick way to look at the performance of the district or school on AYP.

Posted in AYP, Data Analysis, New Hampshire, Tools | Tagged , , | Leave a comment

Goal Setting for Students

Last month I wrote about the importance of students knowing their learning target. There is research that supports the power of students knowing where they stand today and where they are expected to end up. Last week in the Wall Street Journal Online there was an article on the power of kids working on goals. The article cited research that found that a student’s ability to set realistic goals was linked to higher grades, lower college dropout rates and greater well being in adulthood. Unfortunately, a Gallup Survey found that only 42% of children ages 10-18 were “energetically pursuing their goals.”
Goal setting should be included in classroom work. Goal setting has been shown to have short-term value in terms of improving student achievement, but also has clear long-term value for improving college and life outcomes. Goal setting should include:

  1. Students knowing where they stand today. Not just in terms of a number, but what that number means. If they are performing below grade-level in math or music, what are the areas of the content that need to be addressed. Is it fractions? Is it the ability to play at the appropriate time?
  2. Students need to be able to chunk the goal into reasonable parts. If the goal is lofty make sure there are check-ins along the way. In addition, ensure that the student has opportunities to overcome challenges along the way. If the student misses a benchmark along the way are they prepared to overcome that challenge?
  3. Students need to make their goals public. This does not mean they need to be posted on the wall in the classroom, but they should be shared with their teacher and parents. Goals that are made public are more likely to be achieved.
  4. Students need to receive feedback along the way. The feedback needs to be specific to goal and the task performance of the student. “Good job” feedback tends not to support greater learning.
  5. Students and teachers should follow a format. A couple of goal setting examples were included in the WSJ Online article. Another source for achievement goals is the Poway Unified School District student goal setting page for using NWEA.

Completing a lesson on goal setting and working with students to set goals will take time. However, the potential gains for the students are significant.

Posted in Goal Setting, Instruction, NWEA, Research | Tagged | Leave a comment

Collaborative Impact: Effectively Using Data to Improve Performance

A recent New York Times blog describes the success of a Cincinnati-based collaborative organization that aims to have an impact on public education.  By using an approach called “collective impact” many organizations from public schools to local non-profits agreed to work together to solve the greater problem of improving the outcomes for children from the region from “cradle to career”.  In a Stanford Social Innovation article John Kania and Mark Kramer  describe the five conditions for  effective “collective impact”:

  1. Common agenda: a shared vision for change, including a common understanding of the problem and a joint approach to solving it. 
  2. Shared measurement: agreement on the ways success will be measured and reported.
  3. Mutually reinforcing activities: each participant to undertake the specific set of activities at which it excels in a way that supports and is coordinated with the actions of others.
  4. Continuous communication: Participants need face time to see that their own interests will be treated fairly, and that decisions will be made on the basis of objective evidence and the best possible solution to the problem, not to favor the priorities of one organization over another.
  5. Backbone support organization: Creating and managing collective impact requires a separate organization and staff with a very specific set of skills to serve as the backbone for the entire initiative.

In the Cincinnati example the organization creates and distributes an annual report  that clearly reports on their progress.  In no uncertain terms the public and the participating organizations can observe their progress and areas of continued opportunity.  The report card is an annual report that is outcome focused, which is the most effective way to communicate to the public.  When internal discussions are ongoing and decisions are being made using “objective data” it is absolute that the data used are more diverse and have direct connections to the work of all the organizations around the table and include inputs, not just outputs.  The data cannot be just summary data, but must be data that are available intermittently throughout the year.  For example, one of the partner organizations is Mentoring Works is described as collaborating to increase the number of volunteers to meet the need for mentors.  In the Report Card it states (about Mentoring Works) “During the next year Mentoring Works will continue to focus on recruiting, training and retaining new volunteers. In addition, we will begin sharing impact data on how mentoring works in Cincinnati and Northern Kentucky.”  The sharing of impact data is essential for the Report Card, but what the collaborative group needs to hear and see is monthly reports on their progress towards recruiting, training, and matching mentors.  The collaborative group needs to have feedback loops about whether the mentors are meeting their obligations and whether the relationship is high quality.  These data need to be available far more frequently than annually.  By having more frequent leading indicators the collaborative can assess the potential impact of a partner and also find ways to work together to reach the benchmarks that are not being achieved.

Posted in Data Analysis | Tagged , , | Leave a comment

Visualizing A Process

In the last two years I have seen Adams 14  (where I worked most recently) move more and more towards a standard process for instructional blocks. This process has steps and feedback loops with lots of room for teachers and students to be creative. Recently I was thumbing through this great book Visual Language for Designers. One chapter talked about how to clarify complexity using visuals. One example they used was the process for manufacturing ethanol (image to left). This image got me thinking about how districts could do something similar. What if every classroom had a professionally designed poster of instructional cycle? Of the 90 minute reading/math block? A reminder that is well-designed may be just the ticket to translating a complex process into something far more simple.

Posted in Instruction | Tagged , , | 2 Comments

New Hampshire Legislator Proposes Reducing Age for Compulsory School Attendance

I was a little stunned to read this morning that a New Hampshire legislator (James Parison) has proposed reducing the compulsory school attendance age to 16 (from 18).  The move has been proposed as a parents’ rights issue.  The law would allow students under the age of 18, but older than 16 to dropout with parent permission.  I had taken it as common sense that having a high compulsory school attendance law was good policy because it increased student earning power later in life and increased the likelihood that a student would seek some post-secondary training.

First, I found an article in my dropout references by an economist that shows compulsory schooling laws work as a mechanism to improve student outcomes because lifetime wealth increases by about 15% with an extra year of compulsory schooling.  What’s more students required to attend school are also less likely to report being in poor health, unemployed, and unhappy. As the author notes, “The results are more consistent with the possibility that adolescents ignore or heavily discount future consequences when deciding to drop out of school.”  In other words, have a compulsory school attendance law overcomes teenage short-sightedness.

 Second, New Hampshire needs to consider the type of work force we will need in the future.  A report last summer from Georgetown University’s Center on Education and the Workforce () predicts that jobs requiring post-secondary education will grow by 53,000 in the next ten years for New Hampshire .  The report also predicts that of the 223,000 jobs available in the next ten years only 15,000 will be available to high school dropouts.  New Hampshire ranks 7th in terms of the proportion of its 2018 jobs that will require a Bachelor’s degree, and is 45th in jobs for high school dropouts.  If a well-trained work force is not available or predicted to be available it will be increasingly difficult to attract new businesses to New Hampshire.   

The current compulsory school attendance law would appear to be the best policy for New Hampshire.

Posted in Dropout | Tagged , | Leave a comment

Gates Discusses Teaching with Governors

I heard this story today on Market Place about Bill Gates speaking to the nation’s governors in Washington, D.C. (You can read his blog post and listen to the speech here).  In short, Gates said that given a choice between decreasing class size and focusing on teacher quality school districts will get more bang for their buck by focusing on teachers.  Gates took great pains to make it clear that class sizes approaching 40 were not acceptable, but made it clear that if given a reasonable choice we should focus on teacher quality.  What’s more, he was careful to note that teachers needed more feedback to be effective. 

On the blog there is a graph that shows student spending compared to NAEP scores from 1975 to 2007 (from about $5,000 in 1975 to about $10,000 in 2007).  The graph shows a significant increase in per pupil spending but only modest NAEP gains during that same period.  The graph does not cite its source or note whether the dollar values are relative (Gates also does not say during the speech).  In relative dollars the $5,000 per student in 1975 would be $19,300 using the Consumer Price Index or $15,800 using the GDP inflator (http://www.measuringworth.com/uscompare/).  In other words, this graph might be misleading.

Unfortunately, I think the graph distracts from Mr. Gates’s point, which is that we need to focus on the behaviors of the best teachers and transfer those behaviors to others.

Posted in Teacher Effectiveness | Tagged , , | Leave a comment